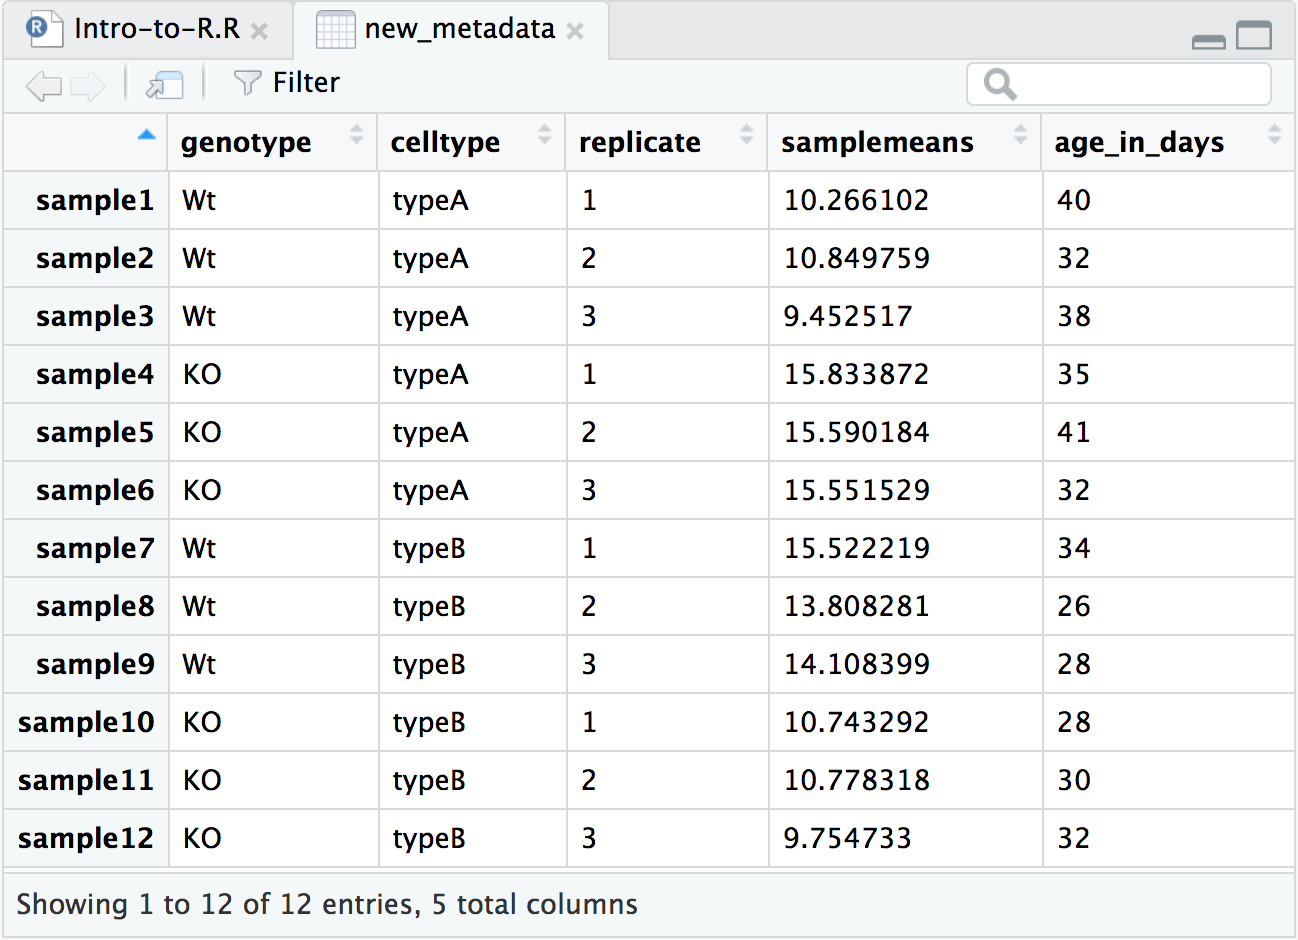
Creating a Sample R Data Frame

To demonstrate how to create a data frame in R, let’s consider a simple example. Suppose we want to create a data frame that contains information about employees in a company, including their names, ages, departments, and salaries.
Step 1: Define the Vectors
First, we need to define the vectors that will serve as the columns of our data frame. We’ll create vectors for name, age, department, and salary.
# Define the vectors
name <- c("John Doe", "Jane Smith", "Bob Johnson", "Alice Brown")
age <- c(30, 28, 35, 32)
department <- c("Sales", "Marketing", "IT", "HR")
salary <- c(50000, 60000, 70000, 55000)
Step 2: Create the Data Frame
Next, we’ll use the data.frame() function to create our data frame, passing in the vectors we defined.
# Create the data frame
employees <- data.frame(
  Name = name,
  Age = age,
  Department = department,
  Salary = salary
)
Step 3: View the Data Frame
Finally, we can view our data frame to ensure it was created correctly.
# View the data frame
print(employees)
This will output:
         Name Age Department Salary
1     John Doe  30       Sales  50000
2   Jane Smith  28   Marketing  60000
3  Bob Johnson  35          IT  70000
4   Alice Brown  32          HR  55000
Full Example
Here’s the complete code:
# Define the vectors
name <- c("John Doe", "Jane Smith", "Bob Johnson", "Alice Brown")
age <- c(30, 28, 35, 32)
department <- c("Sales", "Marketing", "IT", "HR")
salary <- c(50000, 60000, 70000, 55000)

# Create the data frame
employees <- data.frame(
  Name = name,
  Age = age,
  Department = department,
  Salary = salary
)

# View the data frame
print(employees)
Adding More Complexity
For more complex data frames, you might need to handle missing values, perform data cleaning, or merge data from different sources. R provides a wide range of functions and packages to handle these tasks, such as dplyr for data manipulation, tidyr for data cleaning, and readxl or read.csv for importing data from files.
Advanced Operations
Once you have your data frame, you can perform various operations, such as filtering, sorting, and grouping. For example, to filter employees by department, you can use dplyr:
# Install and load dplyr if not already done
# install.packages("dplyr")
library(dplyr)

# Filter employees in the Sales department
sales_employees <- employees %>%
  filter(Department == "Sales")

print(sales_employees)
This will output:
      Name Age Department Salary
1 John Doe  30       Sales  50000
Remember, the key to mastering data frames in R is practice. Experiment with different operations, and explore the vast array of functions and packages available for data manipulation and analysis.
