When working with data in Power Query, there are often situations where you need to transform data from rows to columns. This process is commonly referred to as pivoting. Power Query, a powerful data transformation and loading tool in Excel and Power BI, provides an intuitive way to achieve this through its user-friendly interface and powerful scripting language, M. In this article, we will delve into the process of transforming rows to columns in Power Query, exploring both the basic steps and more advanced techniques.
Understanding the Basics of Power Query

Before diving into the specifics of transforming rows to columns, it’s essential to have a basic understanding of Power Query. Power Query is a business intelligence tool that allows you to discover, combine, and refine data across a wide variety of sources. It supports a wide range of data sources, from simple Excel spreadsheets to complex databases and web pages. Its primary interface is visual, allowing users to perform complex data manipulation tasks without needing to write code, although for more advanced operations, the M language can be used.
Pivoting in Power Query
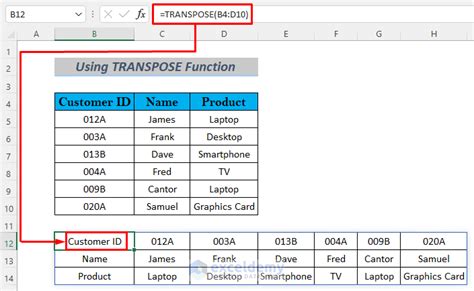
Pivoting is the process of rotating data from a state of rows to columns or vice versa. In Power Query, this is achieved using the “Pivot” and “Unpivot” operations. To pivot data, you select the column that contains the values you want to pivot (i.e., the values that will become your new column headers) and then specify the value column (the column that contains the values you want to display under the new headers). This operation essentially aggregates your data based on the values in the selected columns and performs the necessary transformations.
| Operation | Description |
|---|---|
| Pivot | Transforms rows into columns based on unique values in a column. |
| Unpivot | Transforms columns into rows based on the header names. |

Step-by-Step Guide to Pivoting Data

To pivot data in Power Query, follow these steps:
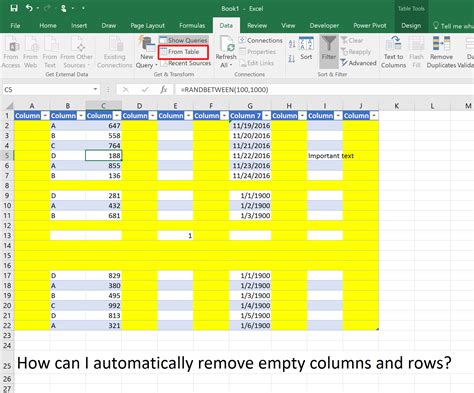
- Load Your Data: Start by loading your data into Power Query. This can be done by going to the “Data” tab in Excel, clicking “From Table/Range,” and then selecting your data.
- Select the Pivot Column: Choose the column that contains the unique values you want to use as your new column headers.
- Pivot the Data: Go to the “Transform” tab, click on “Pivot Column,” and then select the value column. Power Query will then transform your data, creating new columns based on the unique values in the pivot column.
- Aggregate Values: If your data contains multiple rows for the same pivot value, you will need to choose an aggregation method (e.g., Sum, Average, Count) to determine how these values are combined.
Advanced Pivoting Techniques
While the basic pivoting operation is straightforward, there are scenarios where you might need more advanced control over the pivoting process. This can include pivoting multiple columns, handling missing values, or performing more complex aggregations. In such cases, understanding the M language and how to use it to write custom queries can provide the flexibility you need.
Key Points
- Pivoting in Power Query transforms rows into columns based on unique values in a specified column.
- The process involves selecting the pivot column and the value column and then choosing an appropriate aggregation method.
- Advanced scenarios may require the use of the M language for custom queries.
- Pivoting is a powerful tool for data analysis, especially for time-series data and comparative analyses.
- Understanding how to pivot data effectively is crucial for data transformation and loading tasks in Power Query.
In conclusion, pivoting data from rows to columns is a fundamental operation in data transformation that can significantly enhance your data analysis capabilities. By mastering the pivoting functionality in Power Query, you can unlock new insights from your data and present them in a more meaningful and accessible way. Whether you're working with simple datasets or complex, multi-dimensional data structures, the ability to transform rows to columns efficiently is a key skill for any data analyst or business intelligence professional.
What is pivoting in Power Query?
+Pivoting in Power Query is the process of rotating data from rows to columns or vice versa, based on unique values in a specified column.
How do I pivot data in Power Query?
+To pivot data, select the column you want to pivot, go to the “Transform” tab, click “Pivot Column,” select the value column, and choose an aggregation method if necessary.
What are common use cases for pivoting data?
+Common use cases include transforming time-series data, creating comparative analyses, and reorganizing data for better visualization and understanding.
